Totals hide the story.
Spend may rise because of volume, price, trade timing or inefficient vehicles. The total cannot tell you which.
Fuel totalVisibleReason behind itPulse
New module · iWantFuel Pulse
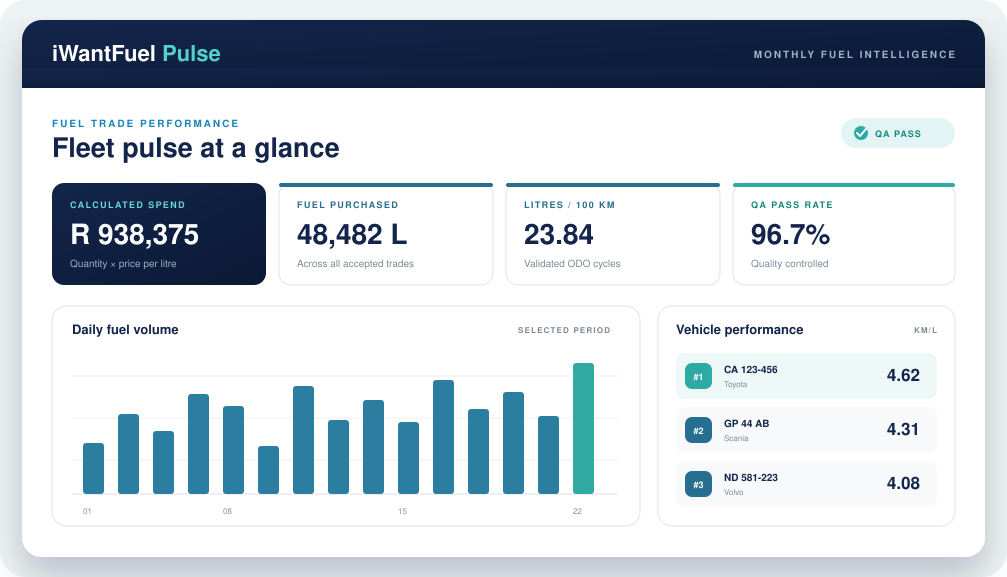
iWantFuel Pulse turns every verified trade into a management view of spend, price, activity, vehicle efficiency and operational risk.
The problem
Monthly totals hide the price, behaviour, vehicle performance and data-quality signals management needs. Pulse connects the total to the evidence behind it.
Spend may rise because of volume, price, trade timing or inefficient vehicles. The total cannot tell you which.
Strong and weak performers disappear when every registration is blended into one number.
ODO decreases, implausible cycles and incomplete records can produce confident but unreliable conclusions.
Managers should be able to move from the monthly position into a vehicle or transaction immediately.
How it works
Pulse finds the commercial signal. Its control layer decides what is defensible enough to report.
The logged-in iWantFuel account determines the client. A user ID in the URL cannot move the report into another client account.
The control layer
Pulse keeps commercial insight and data discipline in the same report, so the conclusion never outruns the evidence.
The logged-in iWantFuel account controls every trade and profile query.
The selected period follows the user into the main report, PDF and drill-downs.
Only Pass, Passed or QA Pass trades can enter consumption cycles.
Current ODO must be higher than the last usable reading.
Cycles outside 0.5–30.0 km/L are excluded from trusted ranking.
Duplicates, missing fields and ODO anomalies remain clear and actionable.
What you receive
Spend, litres, price, activity, product mix, sites, controls and all vehicles ranked in one visual report.
Open the interactive vehicle report or create a polished vehicle PDF without losing the selected period.
{
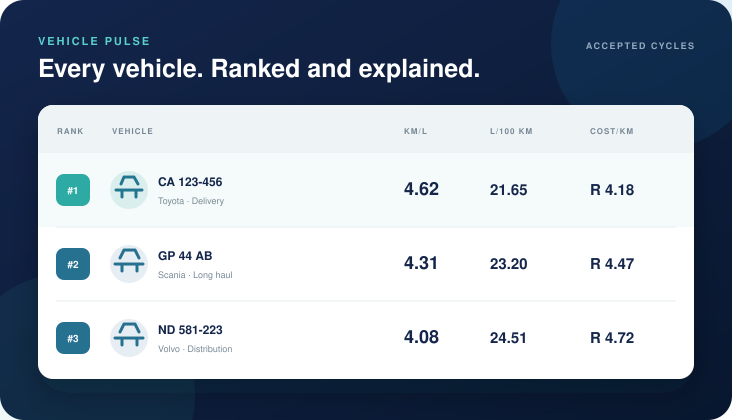
  "vehicle": "CA 123-456",
  "rank": 1,
  "km_per_litre": 4.62,
  "litres_per_100km": 21.65,
  "cost_per_km": "R 4.18",
  "cycles": "accepted"
}If the ODO evidence is missing, stationary, decreasing or implausible, Pulse does not invent consumption. It explains why the result is unavailable.
What changes
Connect the monthly total to litres, price, days, products and sites.
See every registration from strongest to weakest accepted efficiency.
Understand which vehicle makes perform better under comparable evidence.
Bring QA, completeness, duplicates and ODO anomalies forward.
Move from fuel price to the operating cost that matters on the road.
Share the full fleet PDF or a dedicated report for one vehicle.
Visibility calculator
See what a modest avoidable variance in monthly fuel spend could represent when Pulse makes it visible.
Illustrative only. Pulse reports evidence and opportunity; management decides and verifies the operational action.
Security by design
The logged-in iWantFuel user establishes the client boundary. The report does not trust a user ID supplied in the URL.
Getting started
Compare Pulse with the month your team already understands. The detail reveals the value and shows where data quality can improve.
Set the start and end dates for the management view.
Review spend, litres, price, activity and controls together.
Use the full ranking and make performance to find the signal.
Open the vehicle report or create its dedicated PDF.
Ready when management is